UltraVISTA is a deep near-infrared survey on the COSMOS field, and this article describes work underway at CALET to process the fourth UltraVISTA data release, DR4. DR4 is on-track to be publicly released world-wide at the end of 2018 via the ESO archive centre.
Some background
The UltraVISTA survey started in 2009 as one of the six public surveys on ESO’s VISTA wide-field near-infrared telescope. The UltraVISTA team is a led by four P.I.s (Jim Dunlop, Marijn Franx, Olivier LeFvre and Johan Fynbo). Today, even after a decade of operations, VISTA still remains unmatched in survey efficiency speed. Very deep near-infrared images are crucial for a wide variety of extragalactic science applications; the redder near-infrared band means one can sample light from high-redshift galaxies in their rest-frame optical bands which is less affected by dust or star-formation histories. This in turn means estimating physical parameters such as stellar mass or star-formation rate can be made more precisely with the addition of near-infrared bands. Having precise and reliable stellar masses makes comparisons with galaxy formation models much easier.
All this, of course, is well known, and since the first near-infrared arrays became available to astronomers a series of “deep fields” have been observed using progressively larger ground and space-based arrays. UltraVISTA is unique in terms of its size (covering most of the COSMOS field) and depth. All data for UltraVISTA were taken from 2009-2018 in Y,J,H,Ks broad-band and a special narrow band “NB118” data. The survey strategy was designed to produce a series of deeper “stripes” optimised (called the “ultra-deep” survey) for the detection of high-redshift galaxies, and many highly-cited papers have been created from the UltraVISTA dataset. The UltraVISTA near-infrared data has also turned out to be vitally important in producing highly precise photometric redshifts. An accurate determination of the colour-redshift relation is essential for the success of the Euclid mission and that requires the most extensive coverage in colour-colour space possible.
Too much background!
On the ground, processing near-infrared data is hard: the sky background is many times brighter than the faint extragalactic sources we are trying to observe. In addition, the amplitude of the sky background changes on timescales of a few minutes, meaning that any near-infrared processing procedure must carefully compute sky backgrounds for each image. Since the beginning the TERAPIX data centre has been closely involved in the processing of the previous UltraVISTA releases. For each release TERAPIX started from pre-processed data supplied by the CASU and computed sky background for all images using a “two-pass” process where all data was stacked and the objects in the final stack were used to identify which sky pixels in the individual images were potentially contaminated by flux from objects and mask them. The immediate consequence of this is that for each UltraVISTA release, all the input data has to be reprocessed in order to take advantage of our improved knowledge the distribution of faint objects which may contaminate the sky background.
CALET and UltraVISTA
TERAPIX operations ended in June 2017 and the transition to CALET and the CANDIDE computer cluster started in the same time. CALET is well adapted to taking over the UltraVISTA processing for the next-generation UltraVISTA survey (the UltraVISTA “extension”, which will be described in a future post). We started building a new implementation of the TERAPIX VISTA pipeline and are using to reduce DR4. The first version of this pipeline was completed in spring 2018.
UltraVISTA DR4 comprises all data taken during seven years of UltraVISTA survey operations (2009-2016). As before, starting from the CASU processed data we stack the data in each band; this tells us where the objects are. For each input image can mask the same positions in the sliding sky frame computed from the median of the temporally adjacent images to the input image. After photometric and astrometric re-calibration, these sky frames are subtracted from each individual image. Images are resampled and stacked on the COSMOS pixel grid.
Current status (July 2018)
Our new VISTA pipeline is operating on CANDIDE and we have made preliminary stacks in the five broad bands one narrow band data comprising the UltraVISTA survey. We (the core UltraVISTA team) are evaluating the data quality of these stacks but we will provide here a first glimpse of what can expect when the data is released publically through the ESO archive at the end of 2018.
DR4 input data set
All observations on VISTA are “queue scheduled”: this means observations are only carried out if a certain set of critera are met (in traditional observing mode, observations are carried out if only certain minimum requirements are met). For UltraVISTA, data are only take if certain strict image quality constraints are met. Figure 1. shows the image quality of all input data in DR4. DR4 contains around 60,000 images. This means that over the lifetime of the survey image quality is almost identical in all bands.
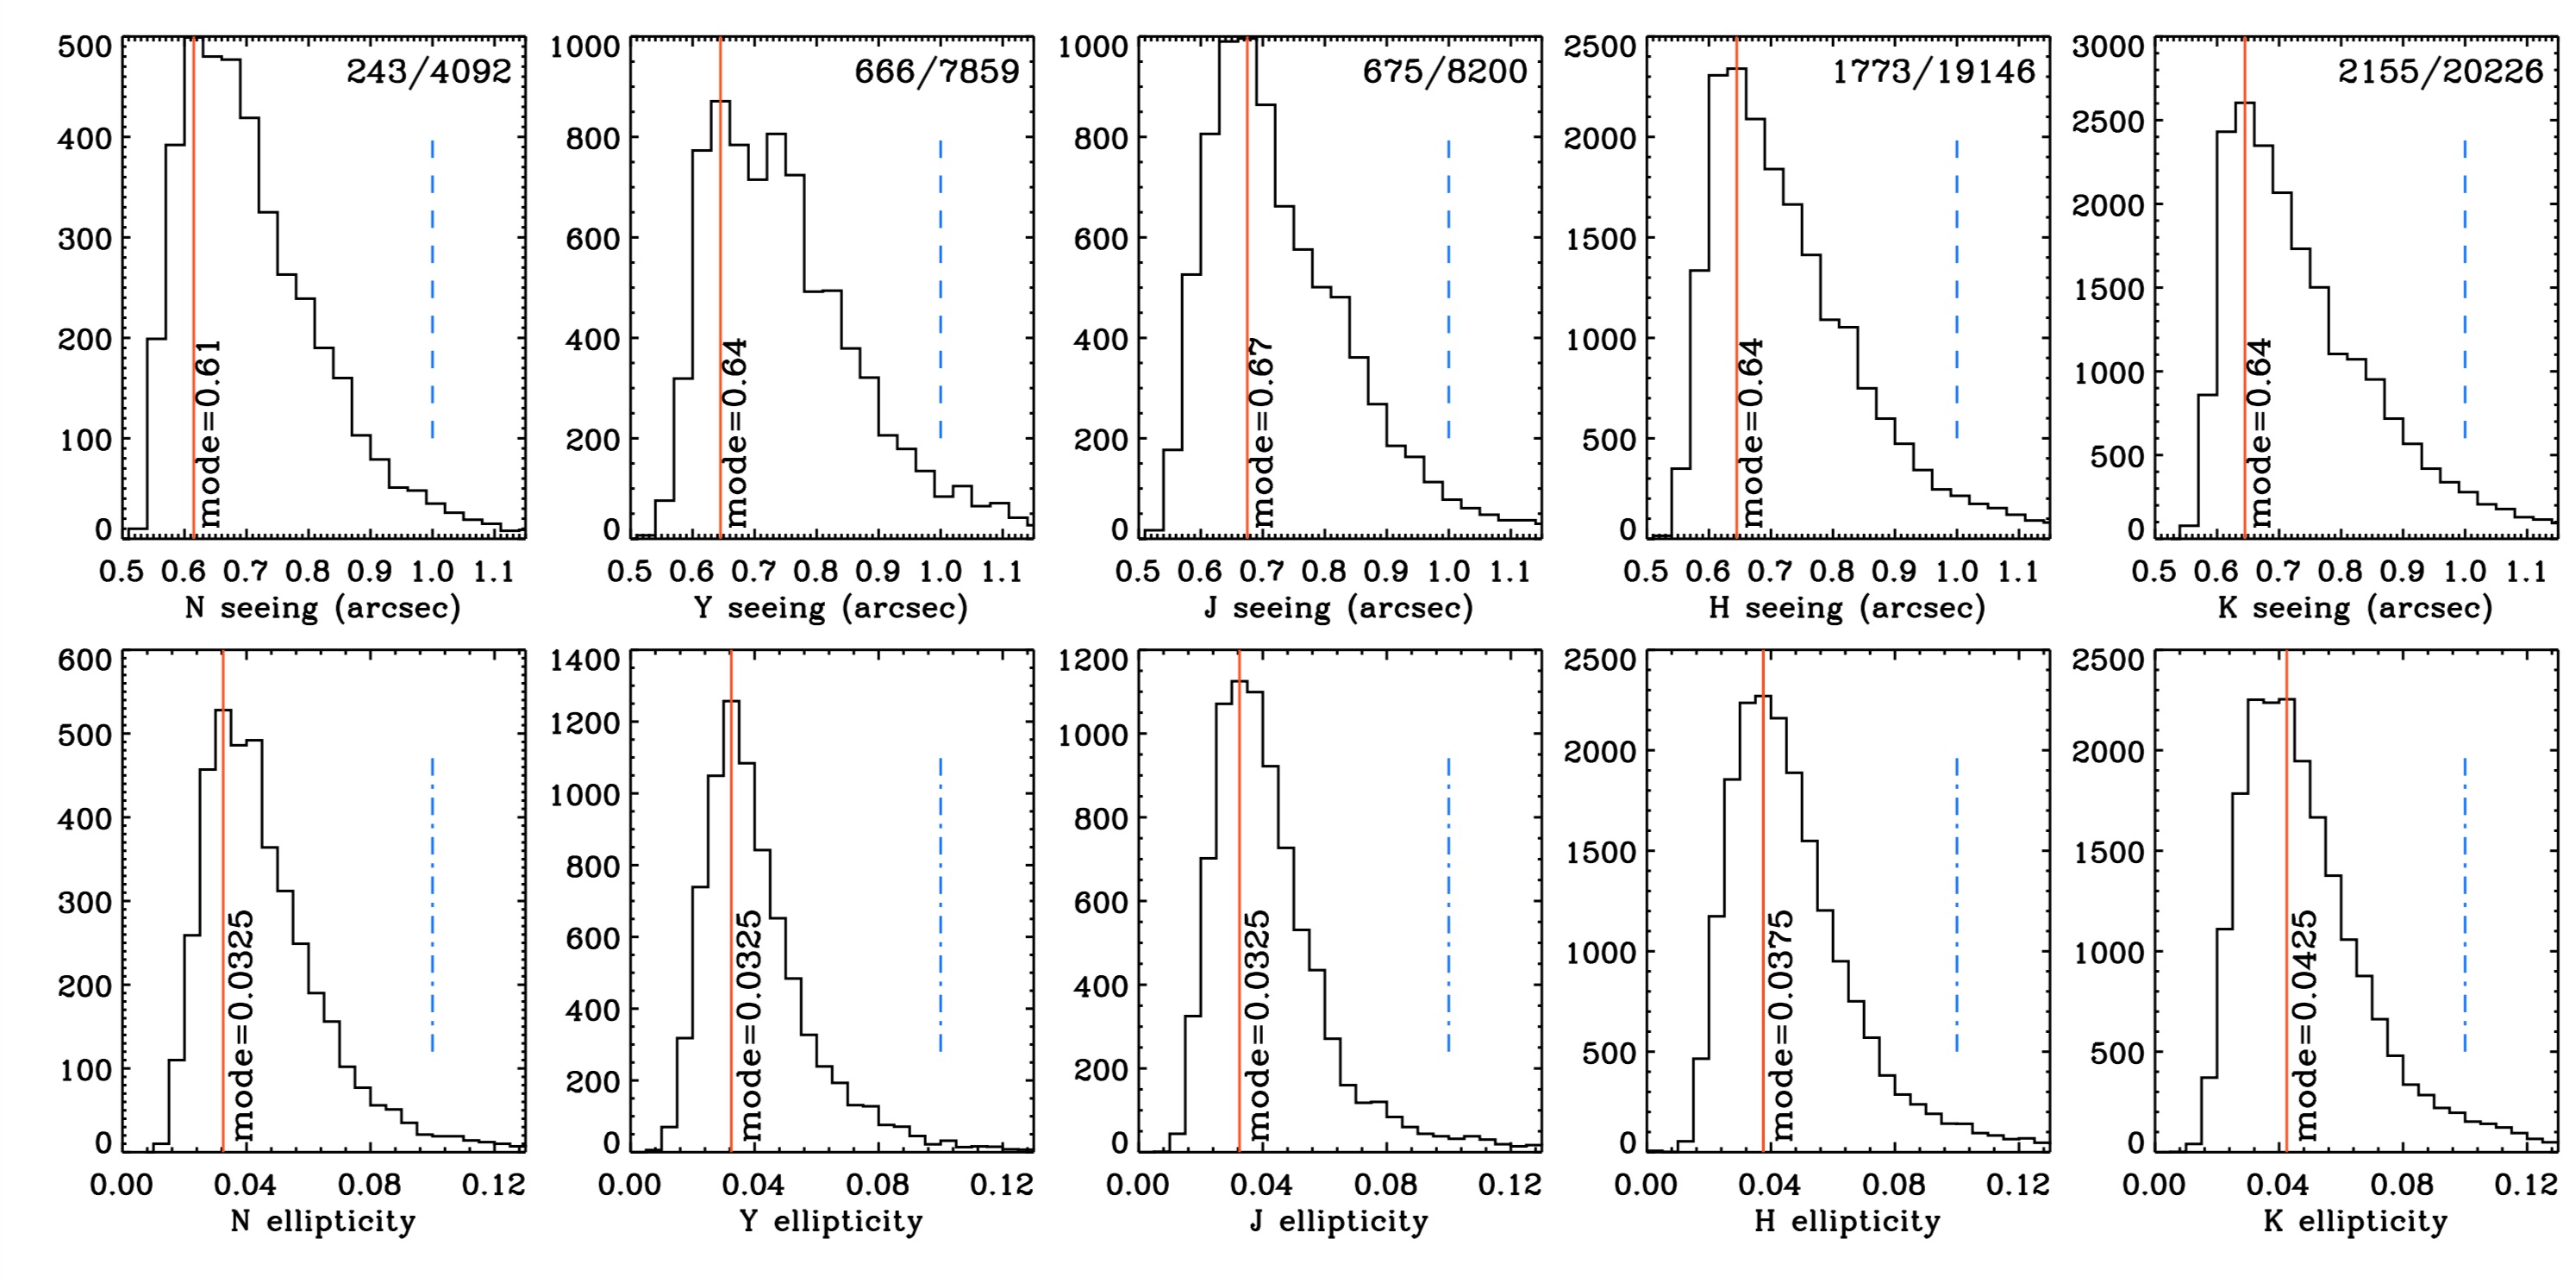
PSF and ellipticity measurements on all DR4 input images, divided by band. The numbers give the total amount of images and the number of images rejected (figure courtesy A. Moneti).
DR4 depths
The UltraVISTA survey is divided into “deep” and “ultra-deep” regions, with the idea to go much deeper over half the total area in the “ultra-deep” areas. However, since the start of the survey, the amount of ancillary data over the whole COSMOS field has greatly increased. In particular, new Spitzer and Hyper Suprime-Cam over the full COSMOS field made a strong case for equalising the depths between the “deep” and “ultra-deep” UltraVISTA stripes. Therefore, in late 2014 we started adding more integration time to the “deep” K-band part of the survey, with the aim of equalising the depths between the stripes. The UltraVISTA extension is continuing to add data to the “deep” stripes in K as well as in J and H.
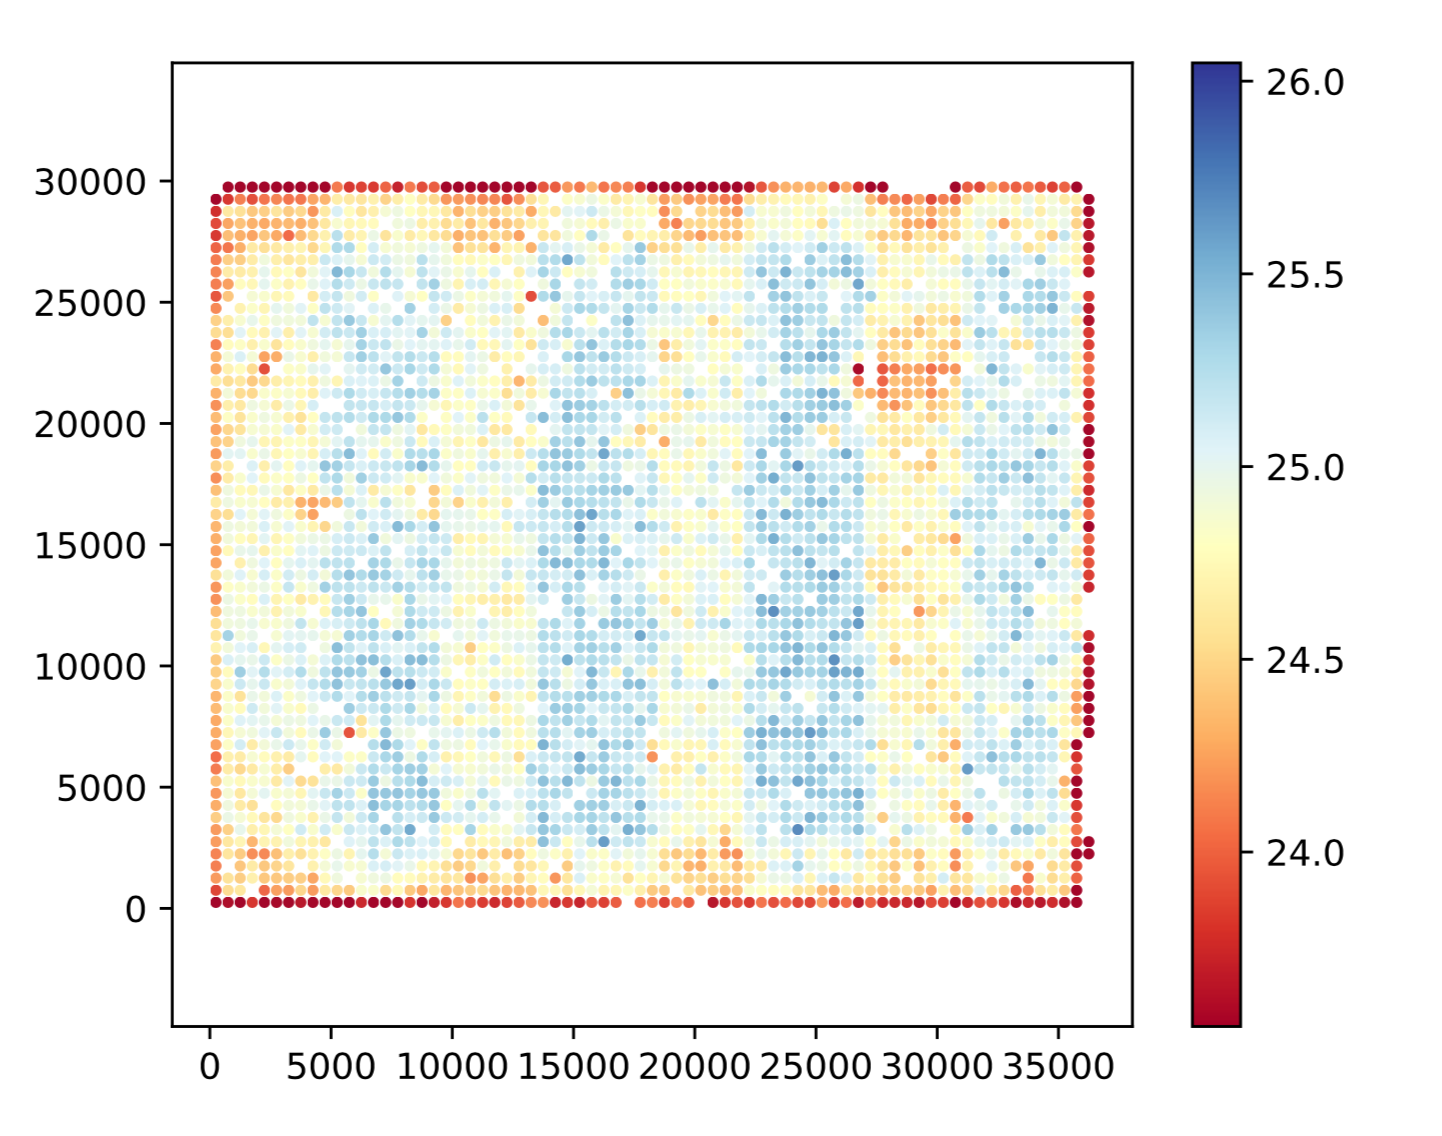
Figure 2. depth map of the preliminary DR4 Ks data (courtesy R. Bowler).
DR4 is the first release since DR1 featuring more integration times in the deep survey stripes. Figure 2. shows the depths measured by calculating the variance in “empty apertures” in the preliminary DR4 Ks band image. Although there is a still a difference between the deep and the ultra-deep stripes, in DR4, the deep areas are almost 0.9 magnitudes deeper than in DR3, dramatically deeper than previous releases.
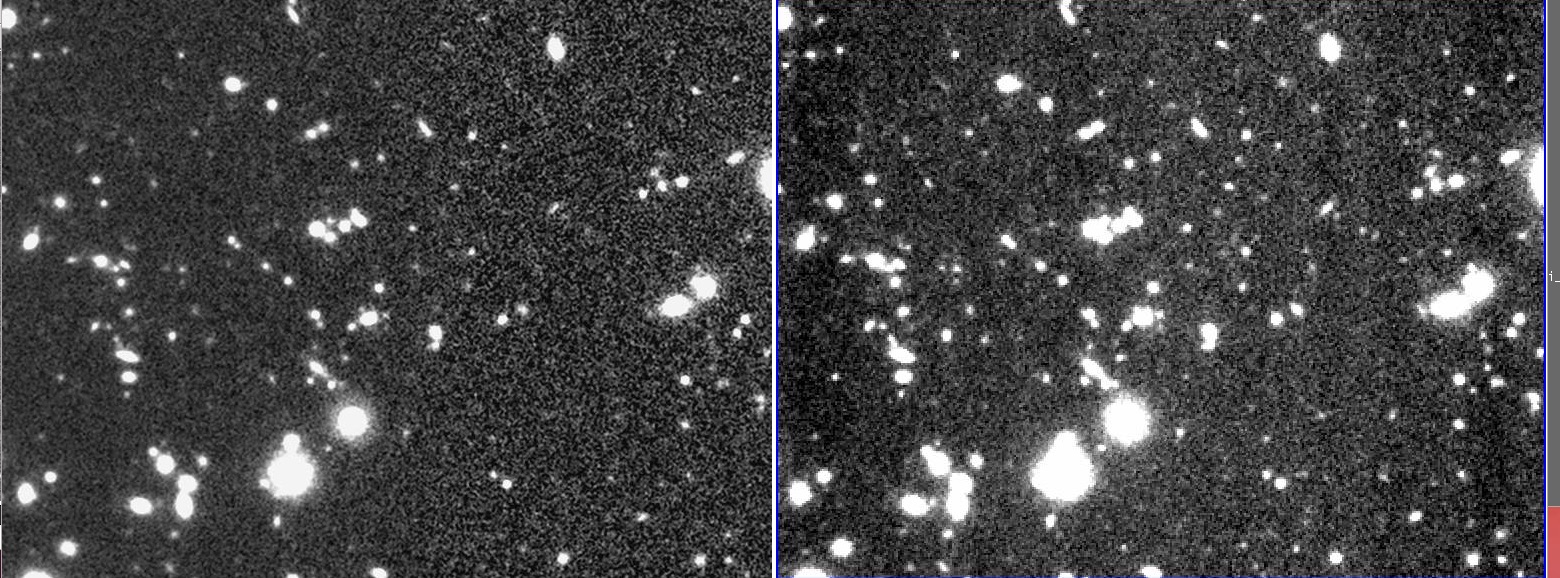
Figure 3. Left panel shows DR3 at the intersection between “ultra-deep” and “deep” stripes (left/right). Right panel shows DR4. Notice the deep region shows many more faint sources.
The left and right panels Figure 4 illustrates visually the difference in depths between DR3 and DR4 on a region between the deep and ultra-deep stripes. The substantial increase in depth in the ultra-deep area is clearly visible.
Astrometric calibration
“Astrometric calibration” means relating the physical system of detector pixels (usually expressed in linear co-ordinates) with an absolute co-ordinate system usually expressed in celestial co-ordinates. This is usually done by measuring the detector co-ordinates of known astrometric reference sources and using this to derive a model of the instrument which can be applied to each individual exposure. Traditionally, the catalogue used for this was 2MASS which was in turn coupled to a denser reference system (such as previous observations of the COSMOS field by other instruments). However, the source density of 2MASS is not large and worse many of the 2MASS sources are saturated on VIRCAM. Traditionally, with 2MASS and COSMOS we could reach an absolute astrometric precision of around 0.2″ RMS and around 0.05″ RMS internally frame-to-frame.
The densely-sampled GAIA astrometric reference catalogues offer a chance to revisit the UltraVISTA astrometric solution. Using the GAIA DR1 we have recomputed the astrometric solutions for all UltraVISTA images. This is shown in Figure 4.
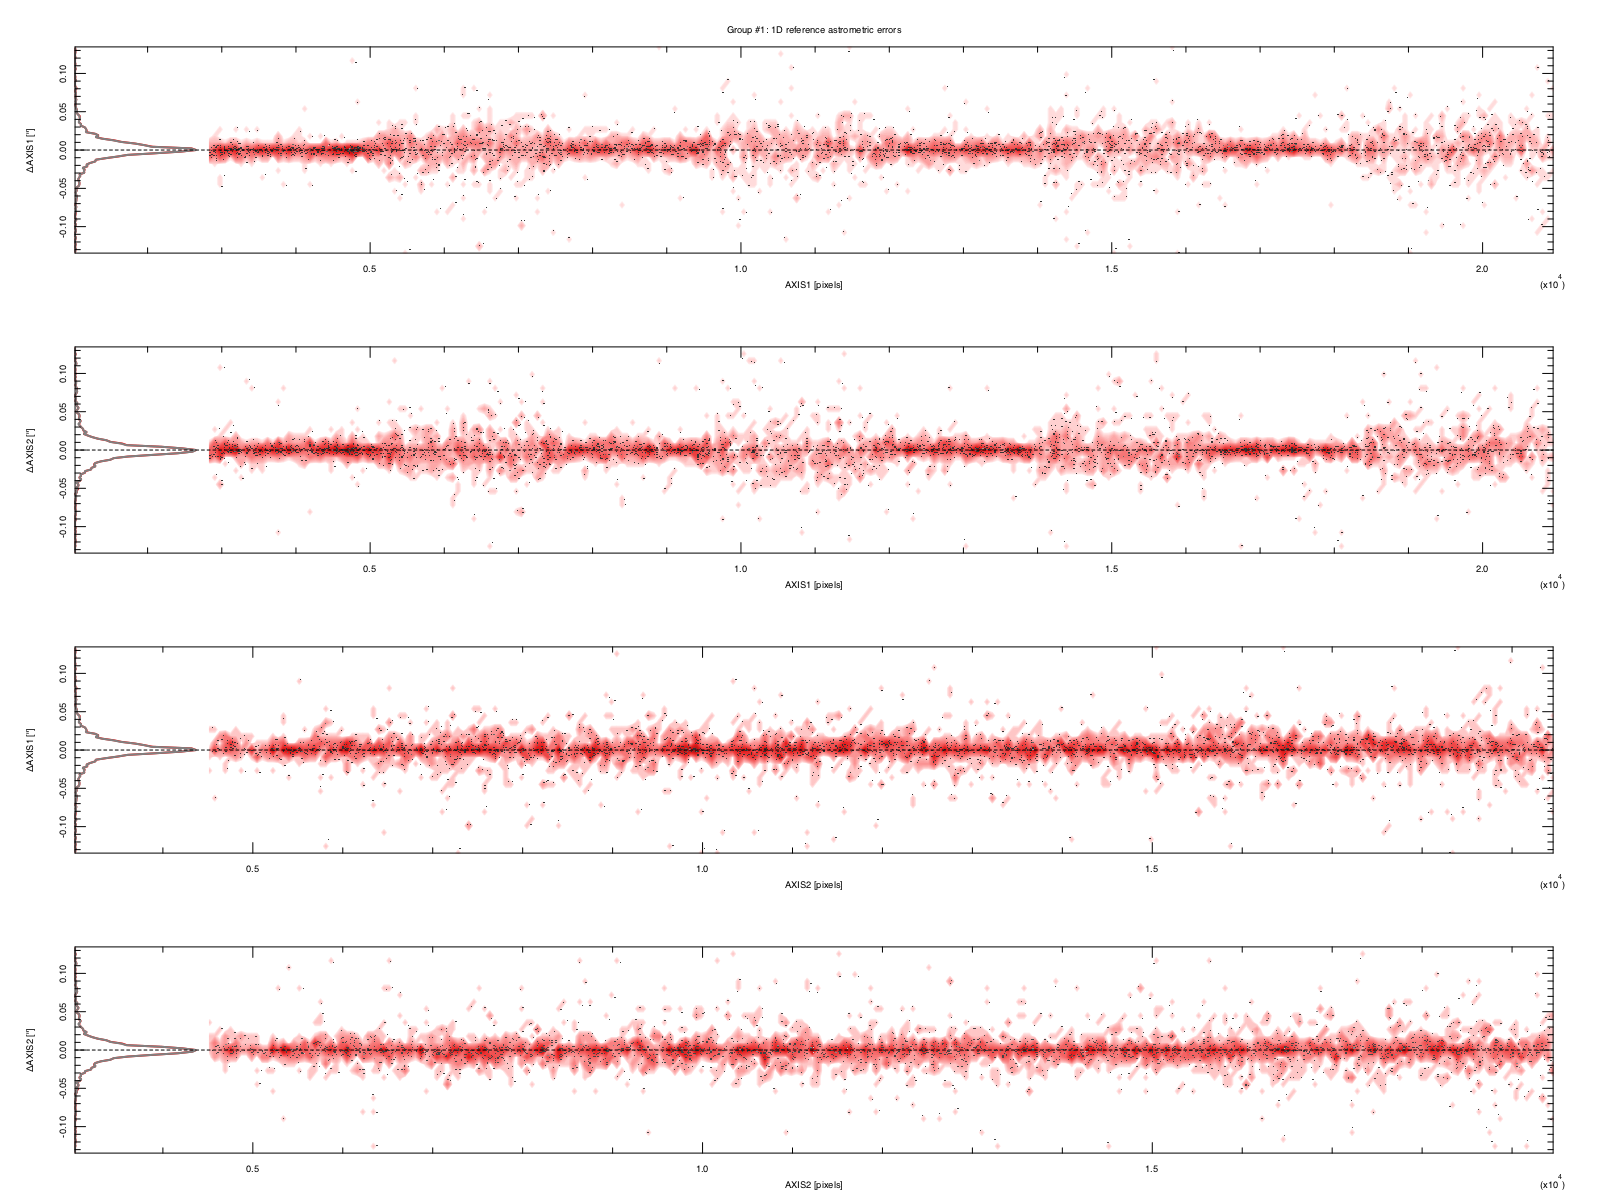
Figure 4. Astrometric errors.
Using Gaia to compute internal and external astrometric solutions results in a dramatic increase in accuracy of more than and order-of-magnitude compared to DR3. Although the internal RMS errors from the previous solutions seem acceptable, in truth they compromised the photometric accuracy of flux measurements of faint unresolved sources in small 2″ apertures: in some cases, these objects could move inside apertures due to these residual astrometric distortions. This meant in turn for photometric redshift measurements much larger apertures were required and the photometric redshift precision was unnecessarily limited.
Safeguarding the heritage of TERAPIX preparing for the next-generation UltraVISTA survey
The TERAPIX VISTA processing pipeline has been developed and refined over the past ten years. With the closure of TERAPIX it was important to safegard the knowledge and algorithms contained within this pipeline. We intend to publicly release the code we have developed for DR4 based on this pipeline, together with documentation and a user manual.
Data release schedule
Currently, there are a few residual issues connected with the preliminary data set, and we intend to carry out more testing before releasing our stacks to the public, which will happen before the end of 2018. Stay tuned…
Acknowledgements
The UltraVISTA DR4 data release has been made possible thanks to the hard work of these people:
Jim Dunlop: OPC reports, communications with ESO
Bo Milvang-Jensen: Phase 2, phase 3, data quality control
Andrea Moneti: Pipeline processing, software developement, data quality control
Patrick Hudelot: Software development, data quality control
Stephane Rouberol: CANDIDE hardware and system administration
Johan Fynbo, Marin Franx, Olivier Le Fèvre: The other UltraVISTA co-PIs
H. J. McCracken: Espresso